Proprietary Software

At ImpactMapper, we believe in increasing the accessibility of beautiful and easy to use analytics and data visualizations so we can elevate the inspirational and powerful social impact being made around the world.

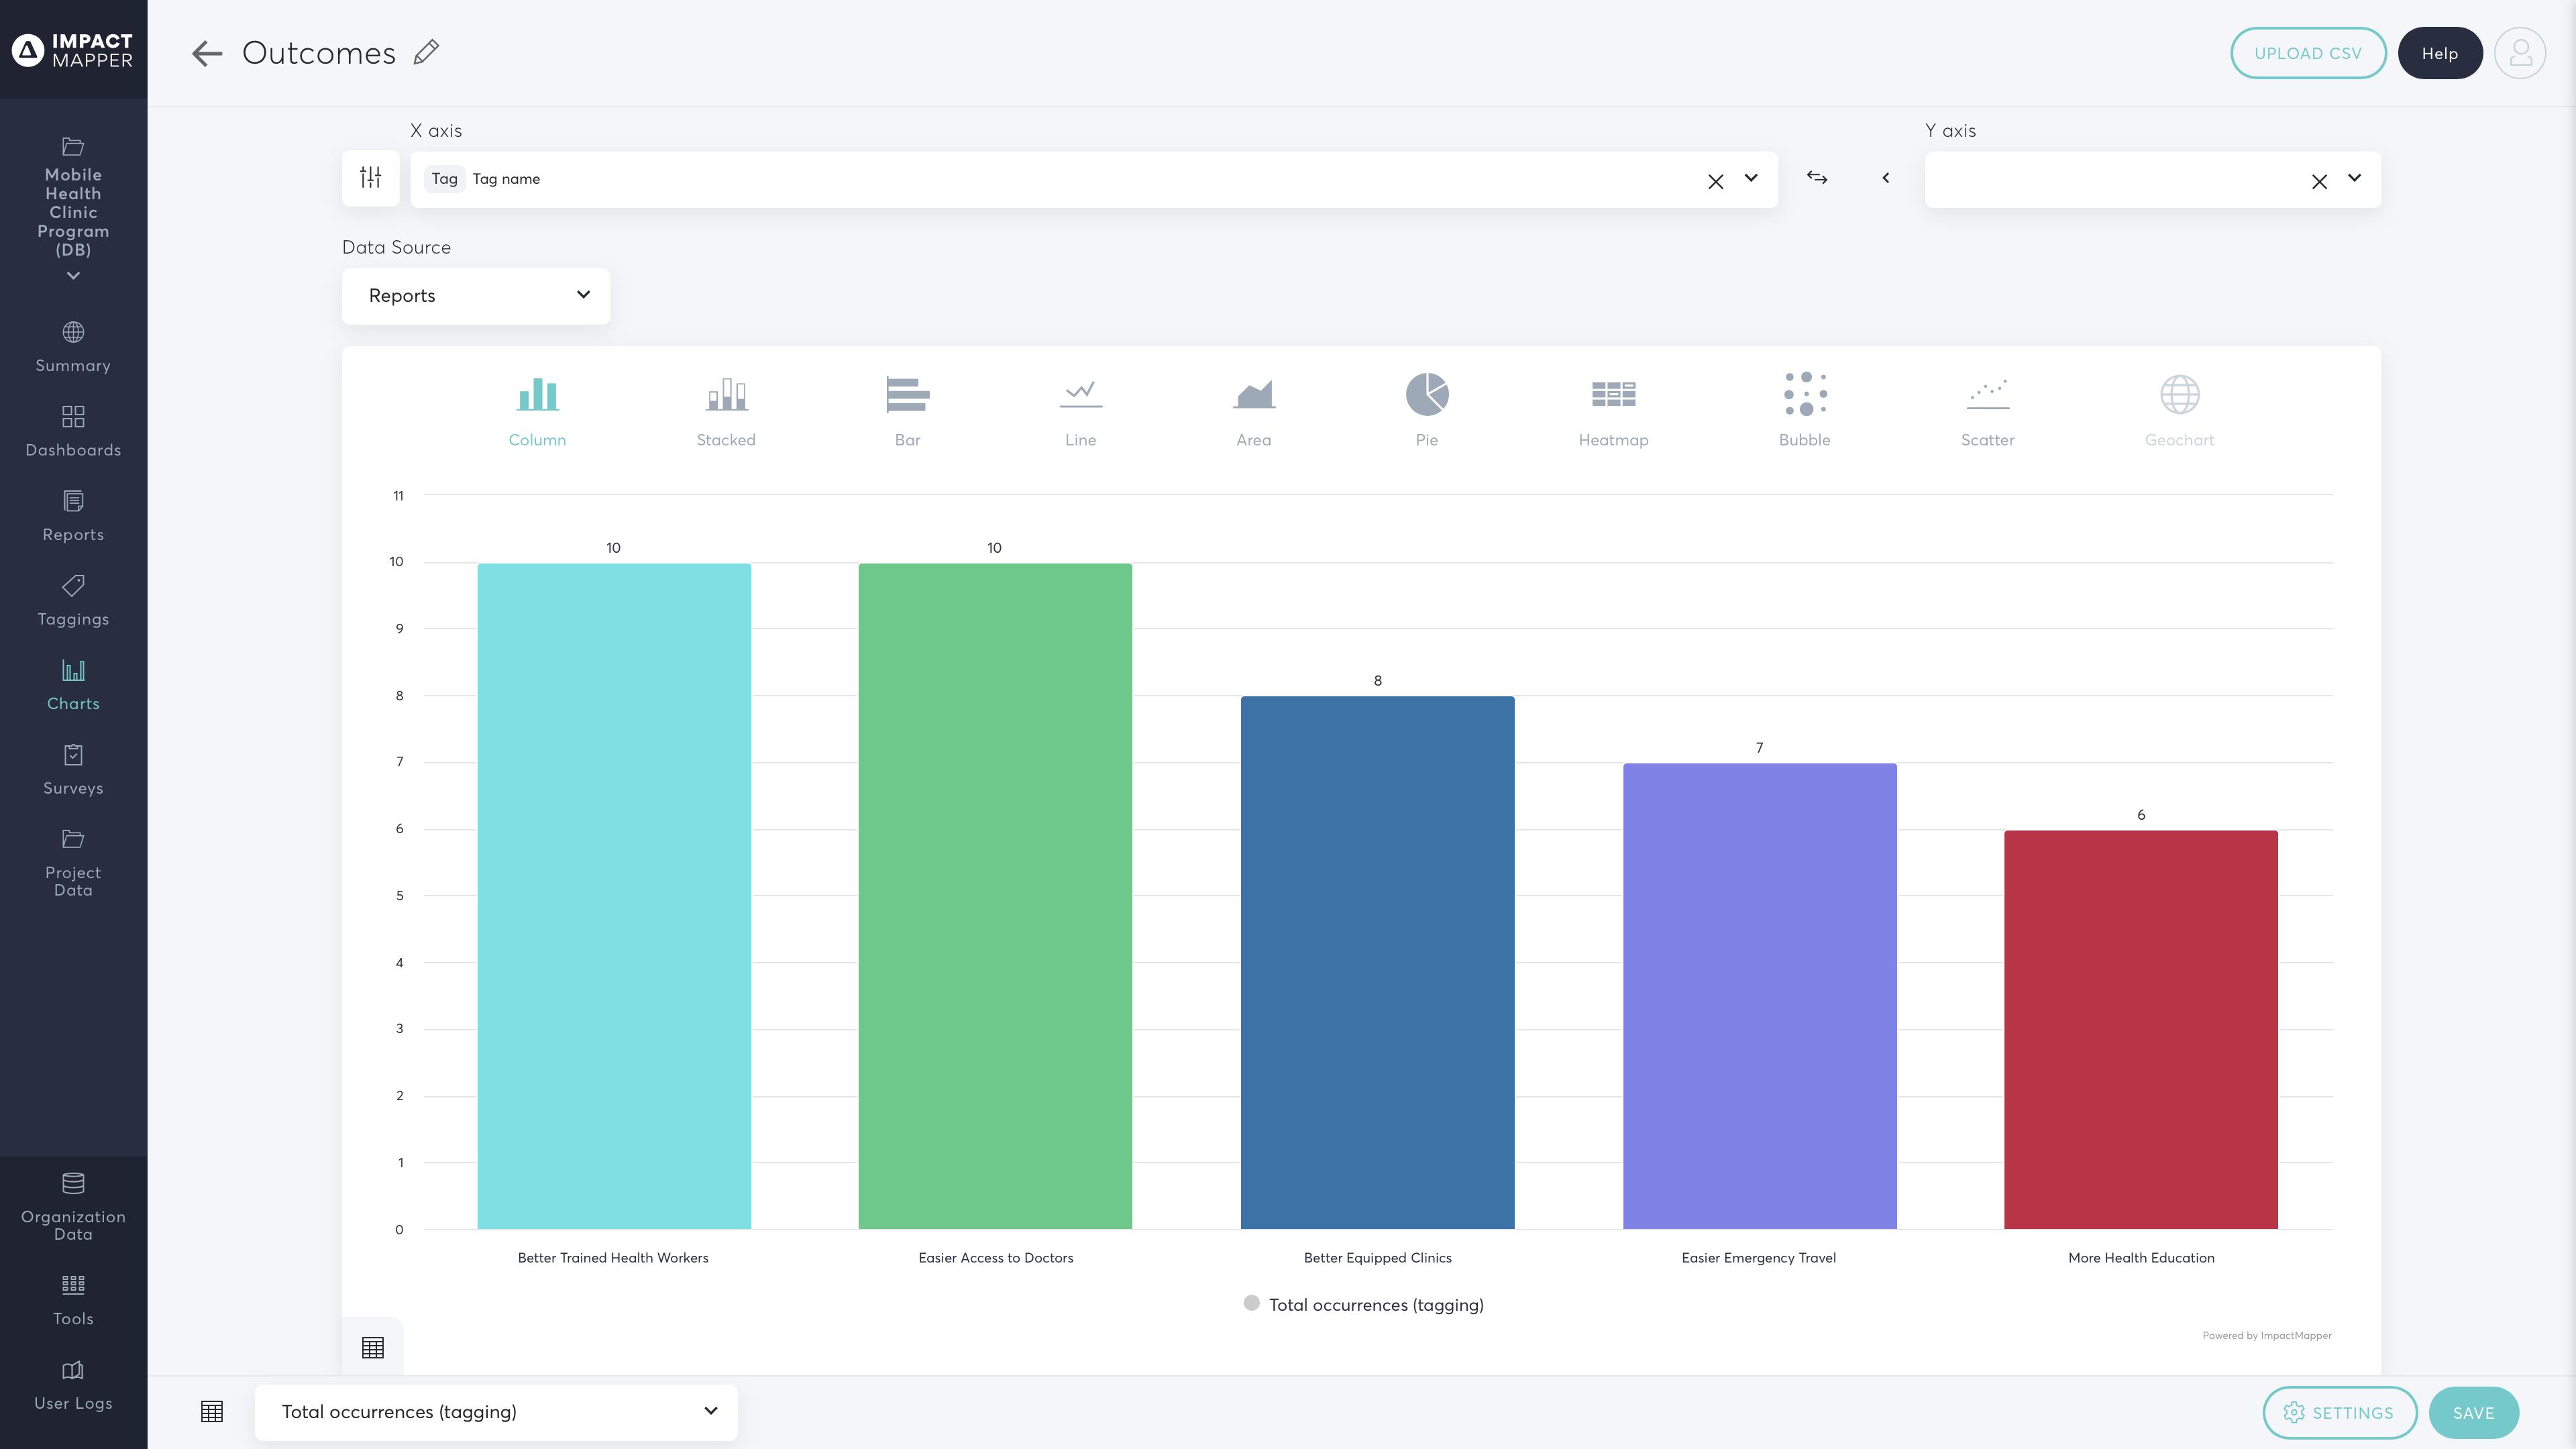
  • Create compelling charts using your reports, survey, grants, funding and tag data
  • Choose from a column, bar, line, area, pie, stacked, combo, bubble, heatmap, scatter and hybrid chart types
  • Export data tables as CSV
  • Save and access configured charts anytime for live up-to-date reporting
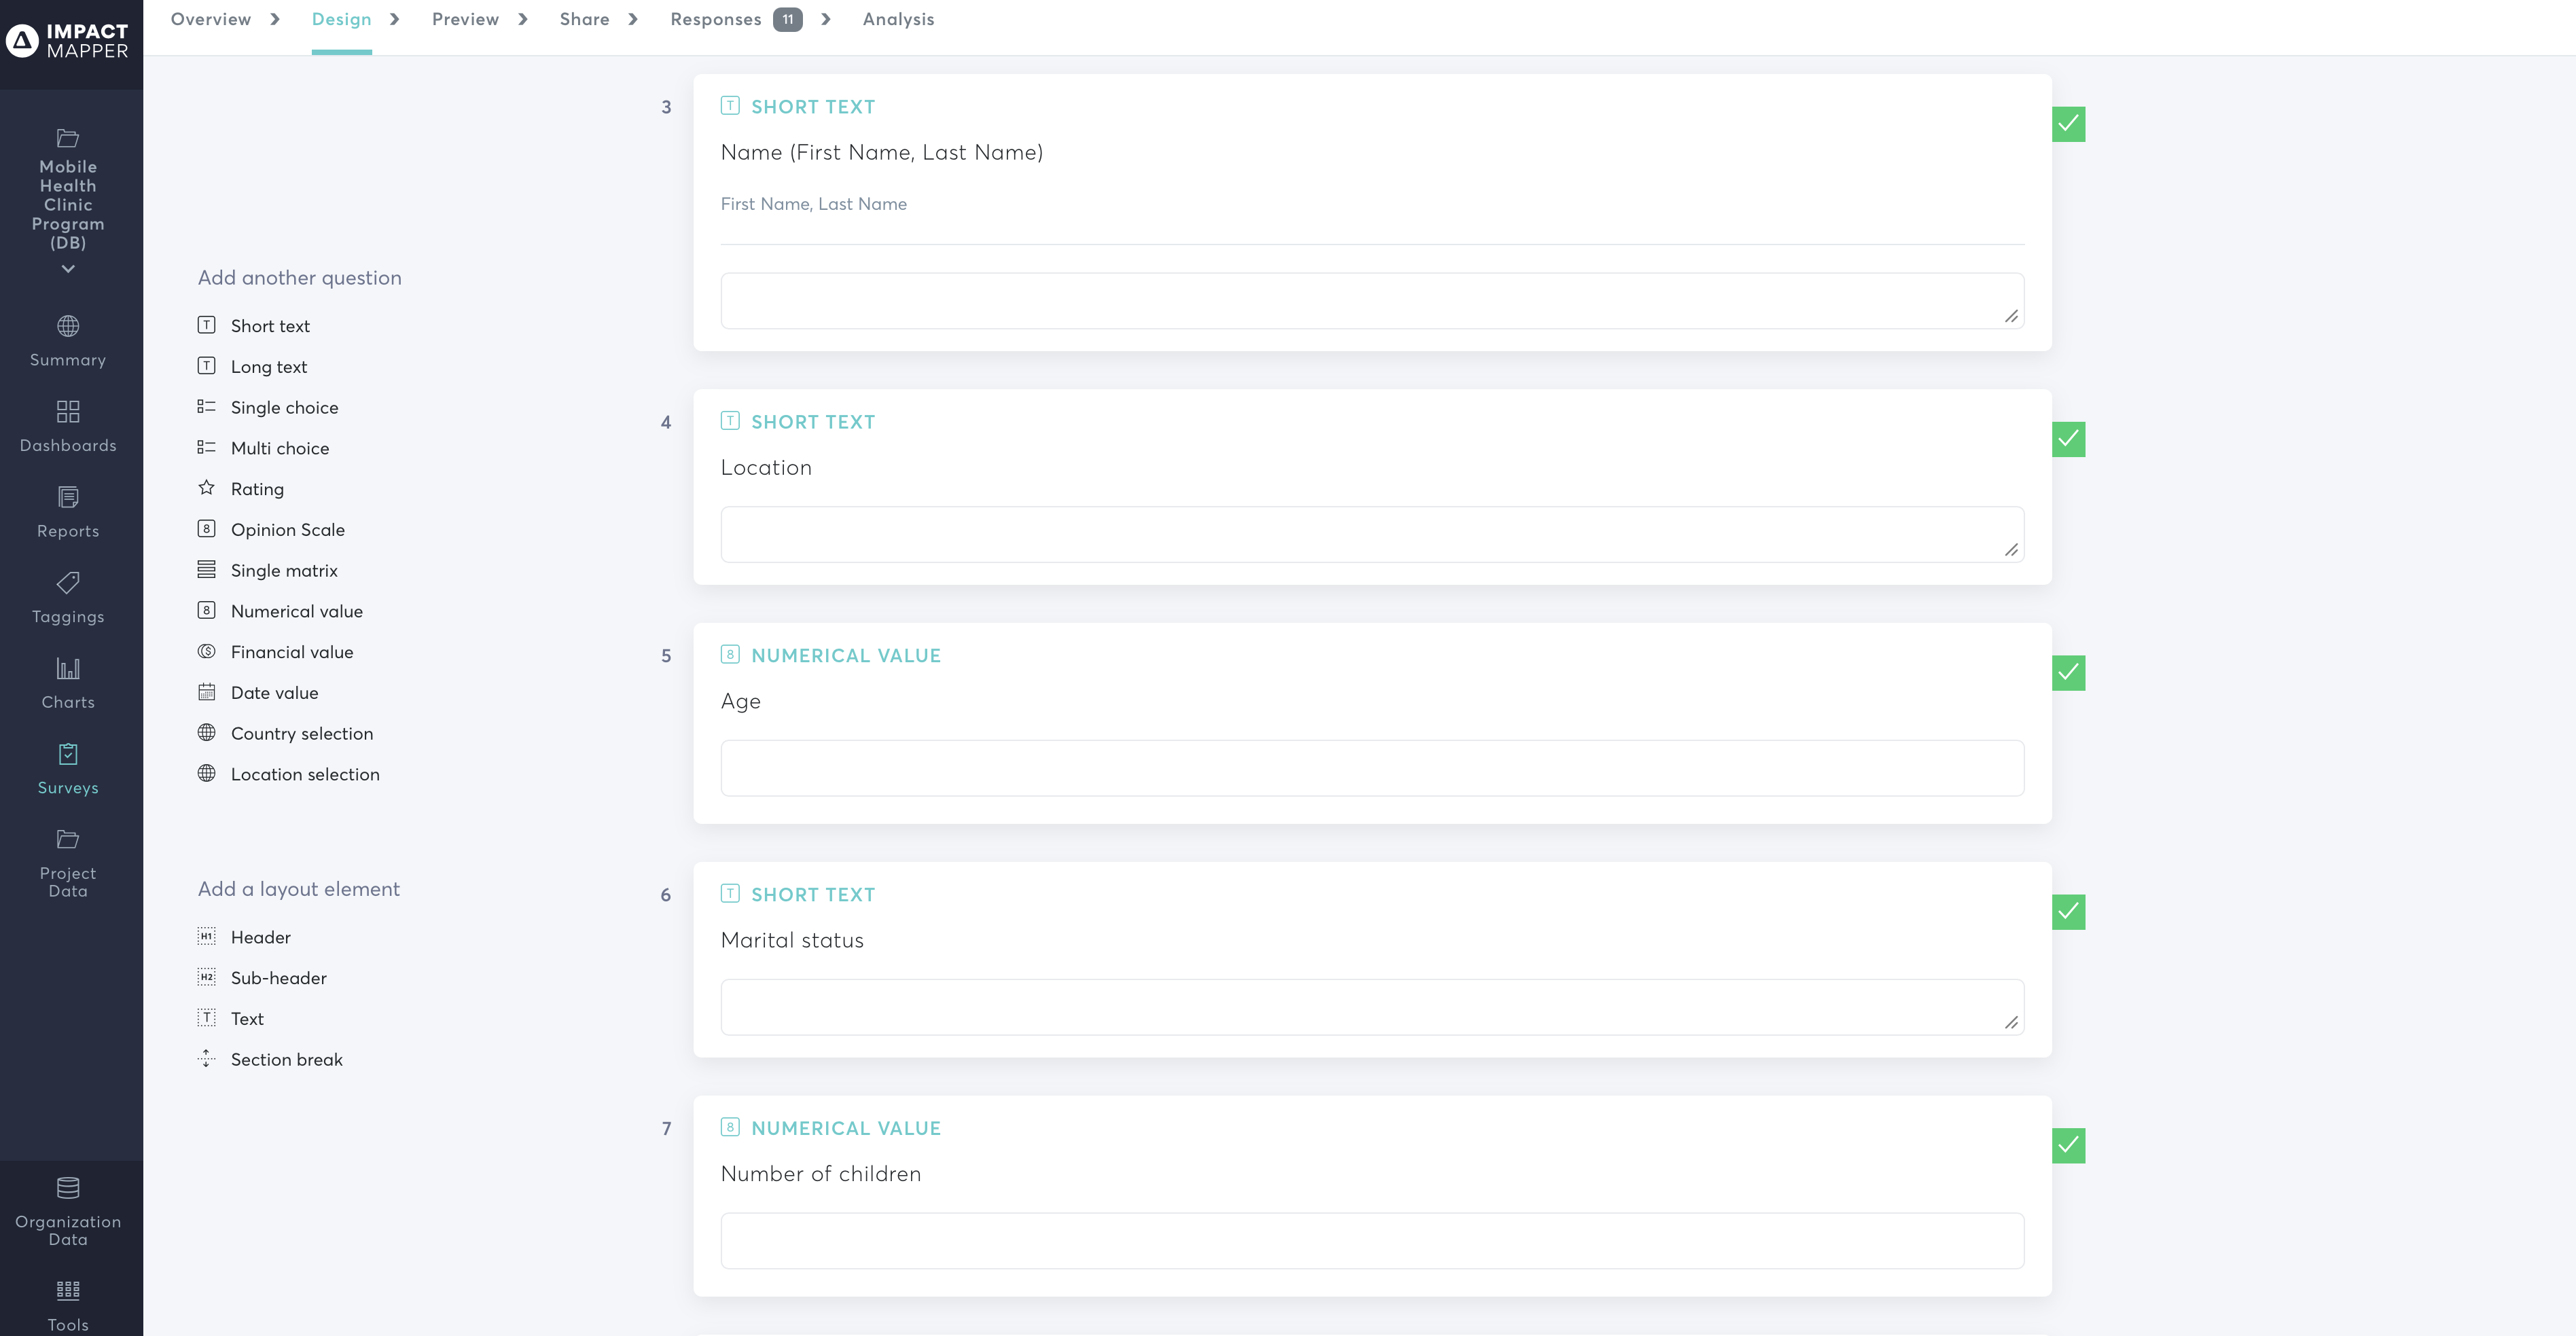
  • Collect data using short text, long text, single choice, multiple choice, single matrix, numerical, financial, rating fields
  • Easily customize your survey structure and contents using header, sub-header, text, section break elements
  • Multilingual features allow you to add your survey translations and get instant analysis*
  • Tag open-ended survey questions to better track trends in text responses and align your custom taxonomies and outcomes
  • Assign numerical values to survey responses that are automatically summed or averaged
  • Survey participant tagging allows respondents to tag or categorize their own answers according to your custom outcomes or any taxonomy
  • Save quotes that are compelling for reporting and sharing your impact
  • Easy survey sharing through public or personalized permalinks for the respondents or QR codes
  • Send out over-time series surveys, pre-post surveys
  • Access instant visualization from crosstabs in a survey
  • Full export of survey responses in PDF and CSV
  • Easily export chart as PNG, PDF, SVG and others for a variety of formats like print, presentation and web
  • Customize your survey with a logo
  • Design and carry out public, private, or anonymous surveys
  • Attach documents to surveys
  • Collect data using locations and aggregate the data through a geochart
  • Track outcomes in qualitative and quantitative data using text, quantity, currency, location, and date Tag types
  • Automatically apply tags to incoming survey responses
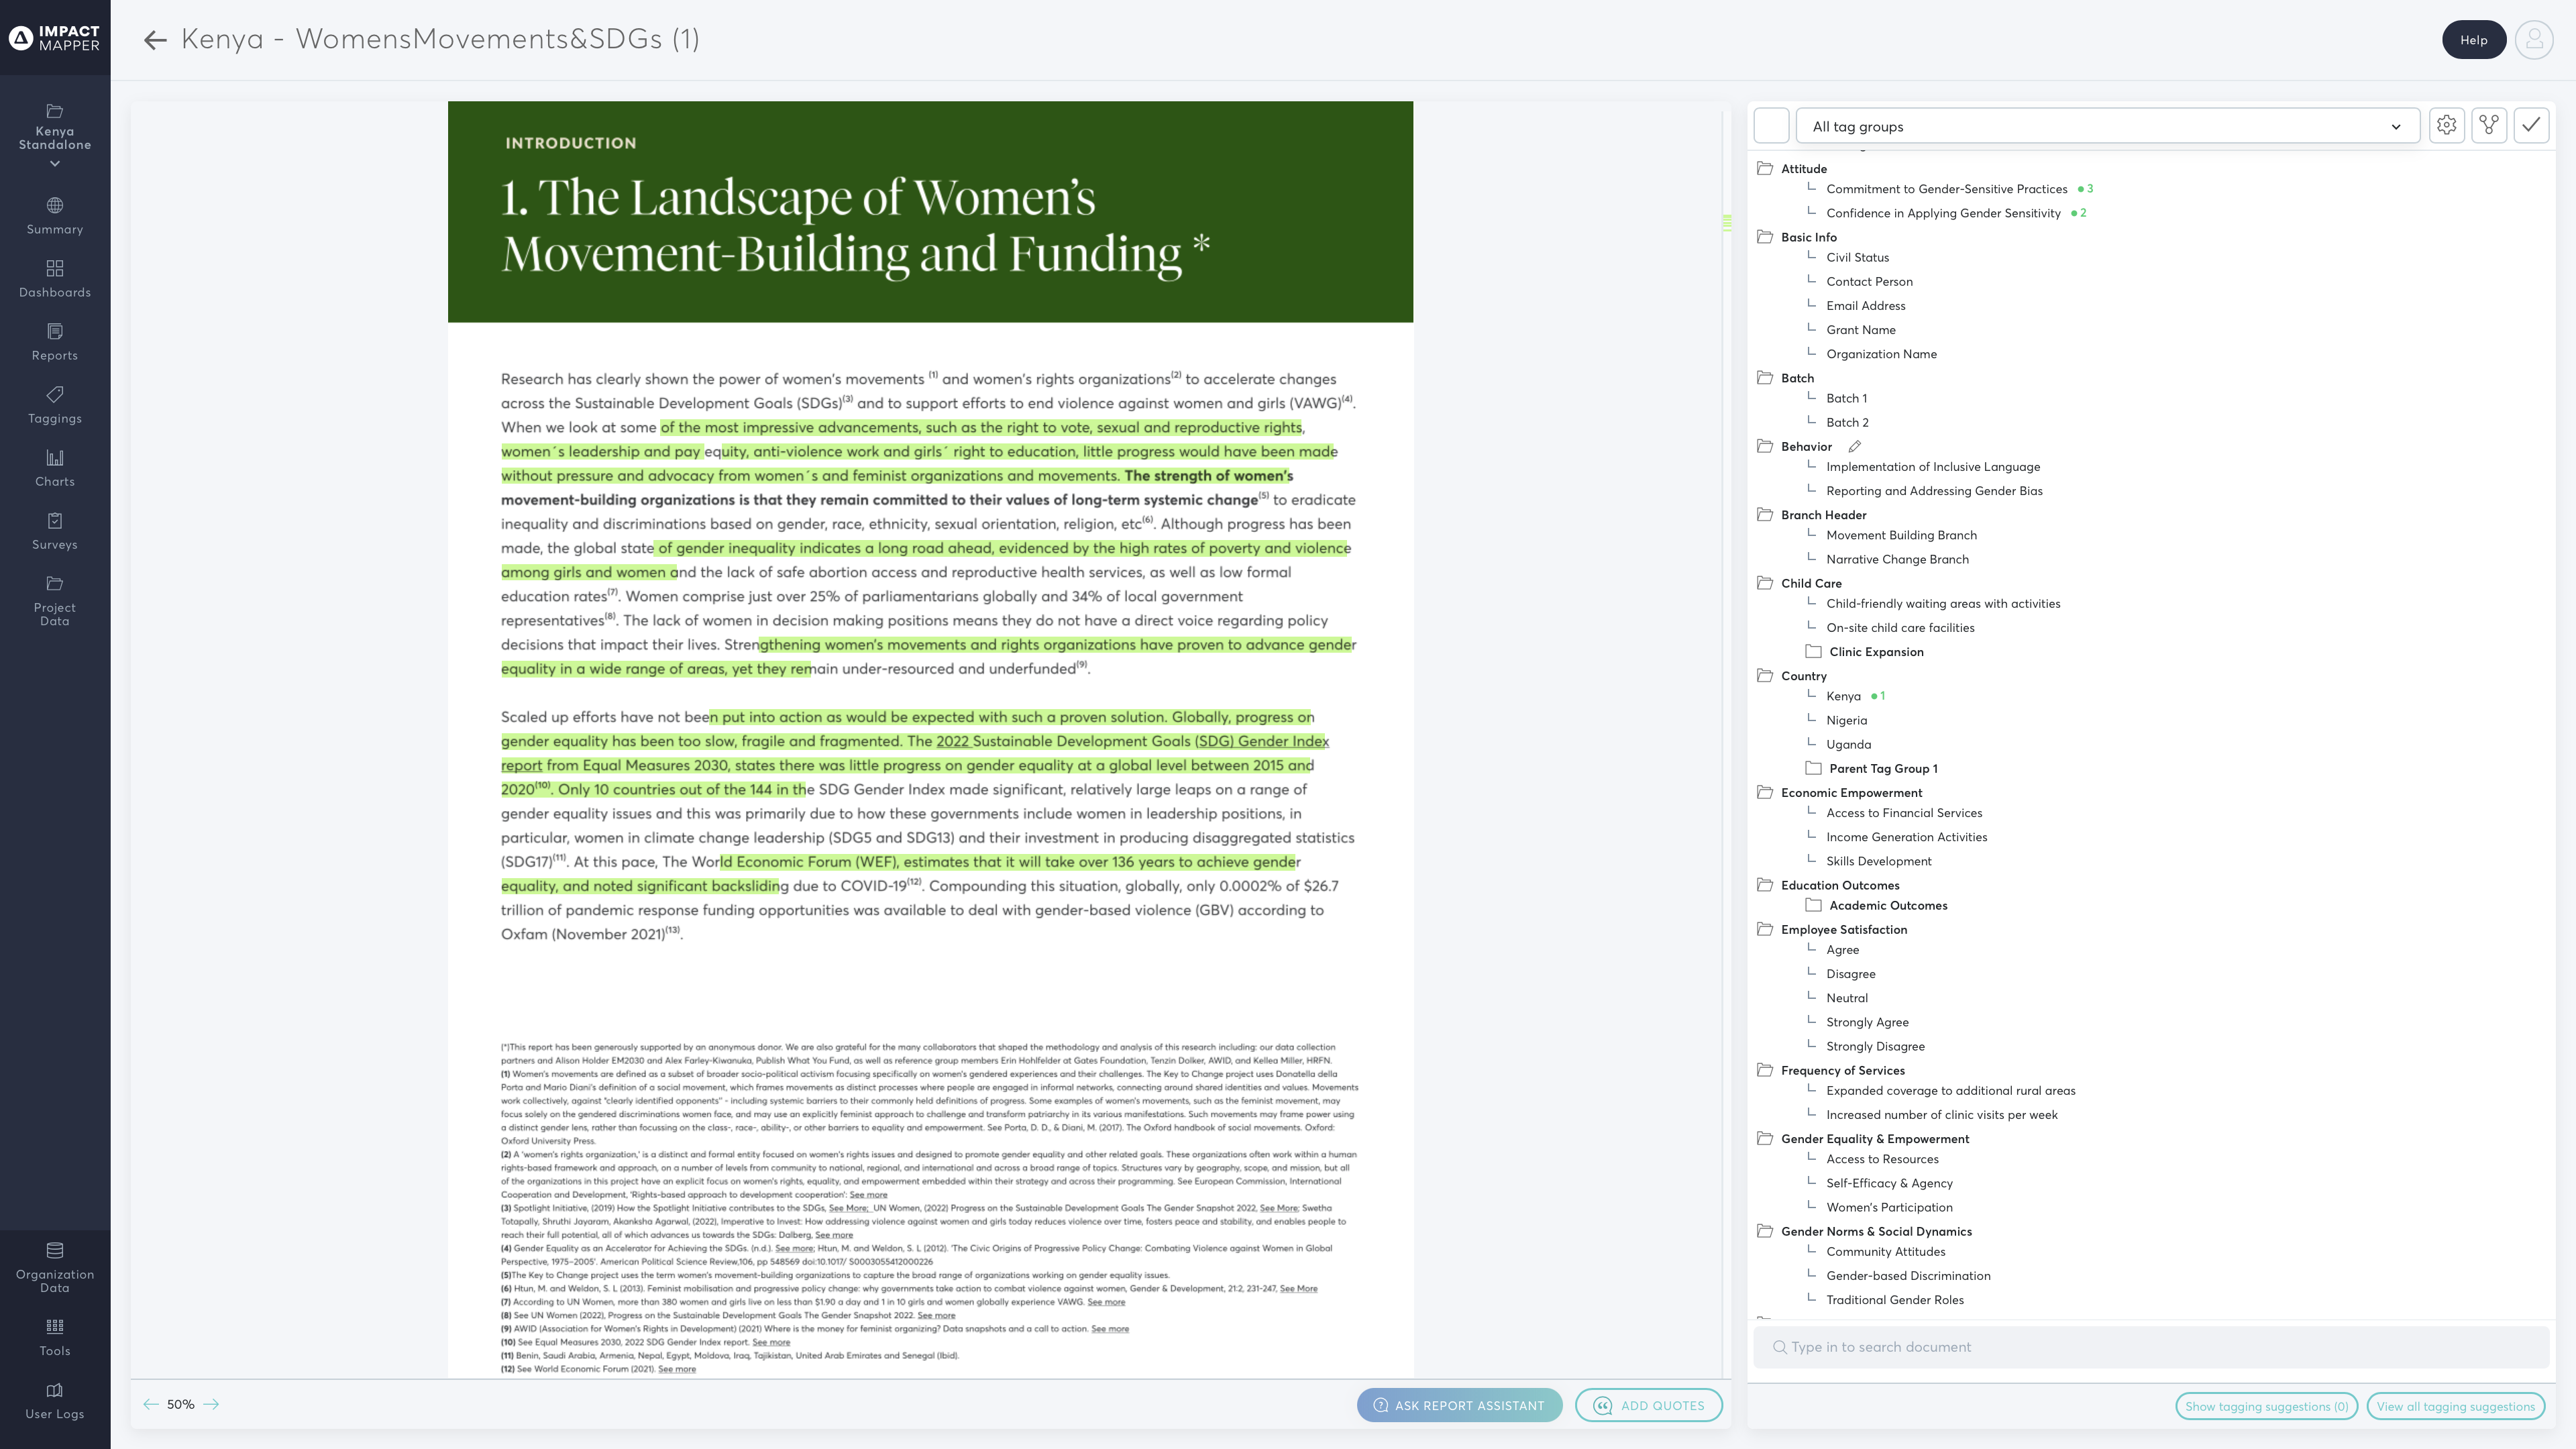
  • Tag text within reports and surveys
  • Review and manage your tag taxonomies
  • Review applied tags and associated text for easier and more accurate impact reporting
  • Upload reports in Docx and PDFs
  • Easily transfer your portfolio data or grants applications from Airtable or Submittable to ImpactMapper *
  • Tag text in reports and align with your custom taxonomies or outcomes (i.e., Tags)
  • Pull out numbers and financial information in text and get sums and average for charting
  • Search and tag text within the report (content analysis)
  • Save quotes from reports
  • Engage in inductive and deductive coding through the text tagging tool
  • Automatic import of interview transcripts through Trint API
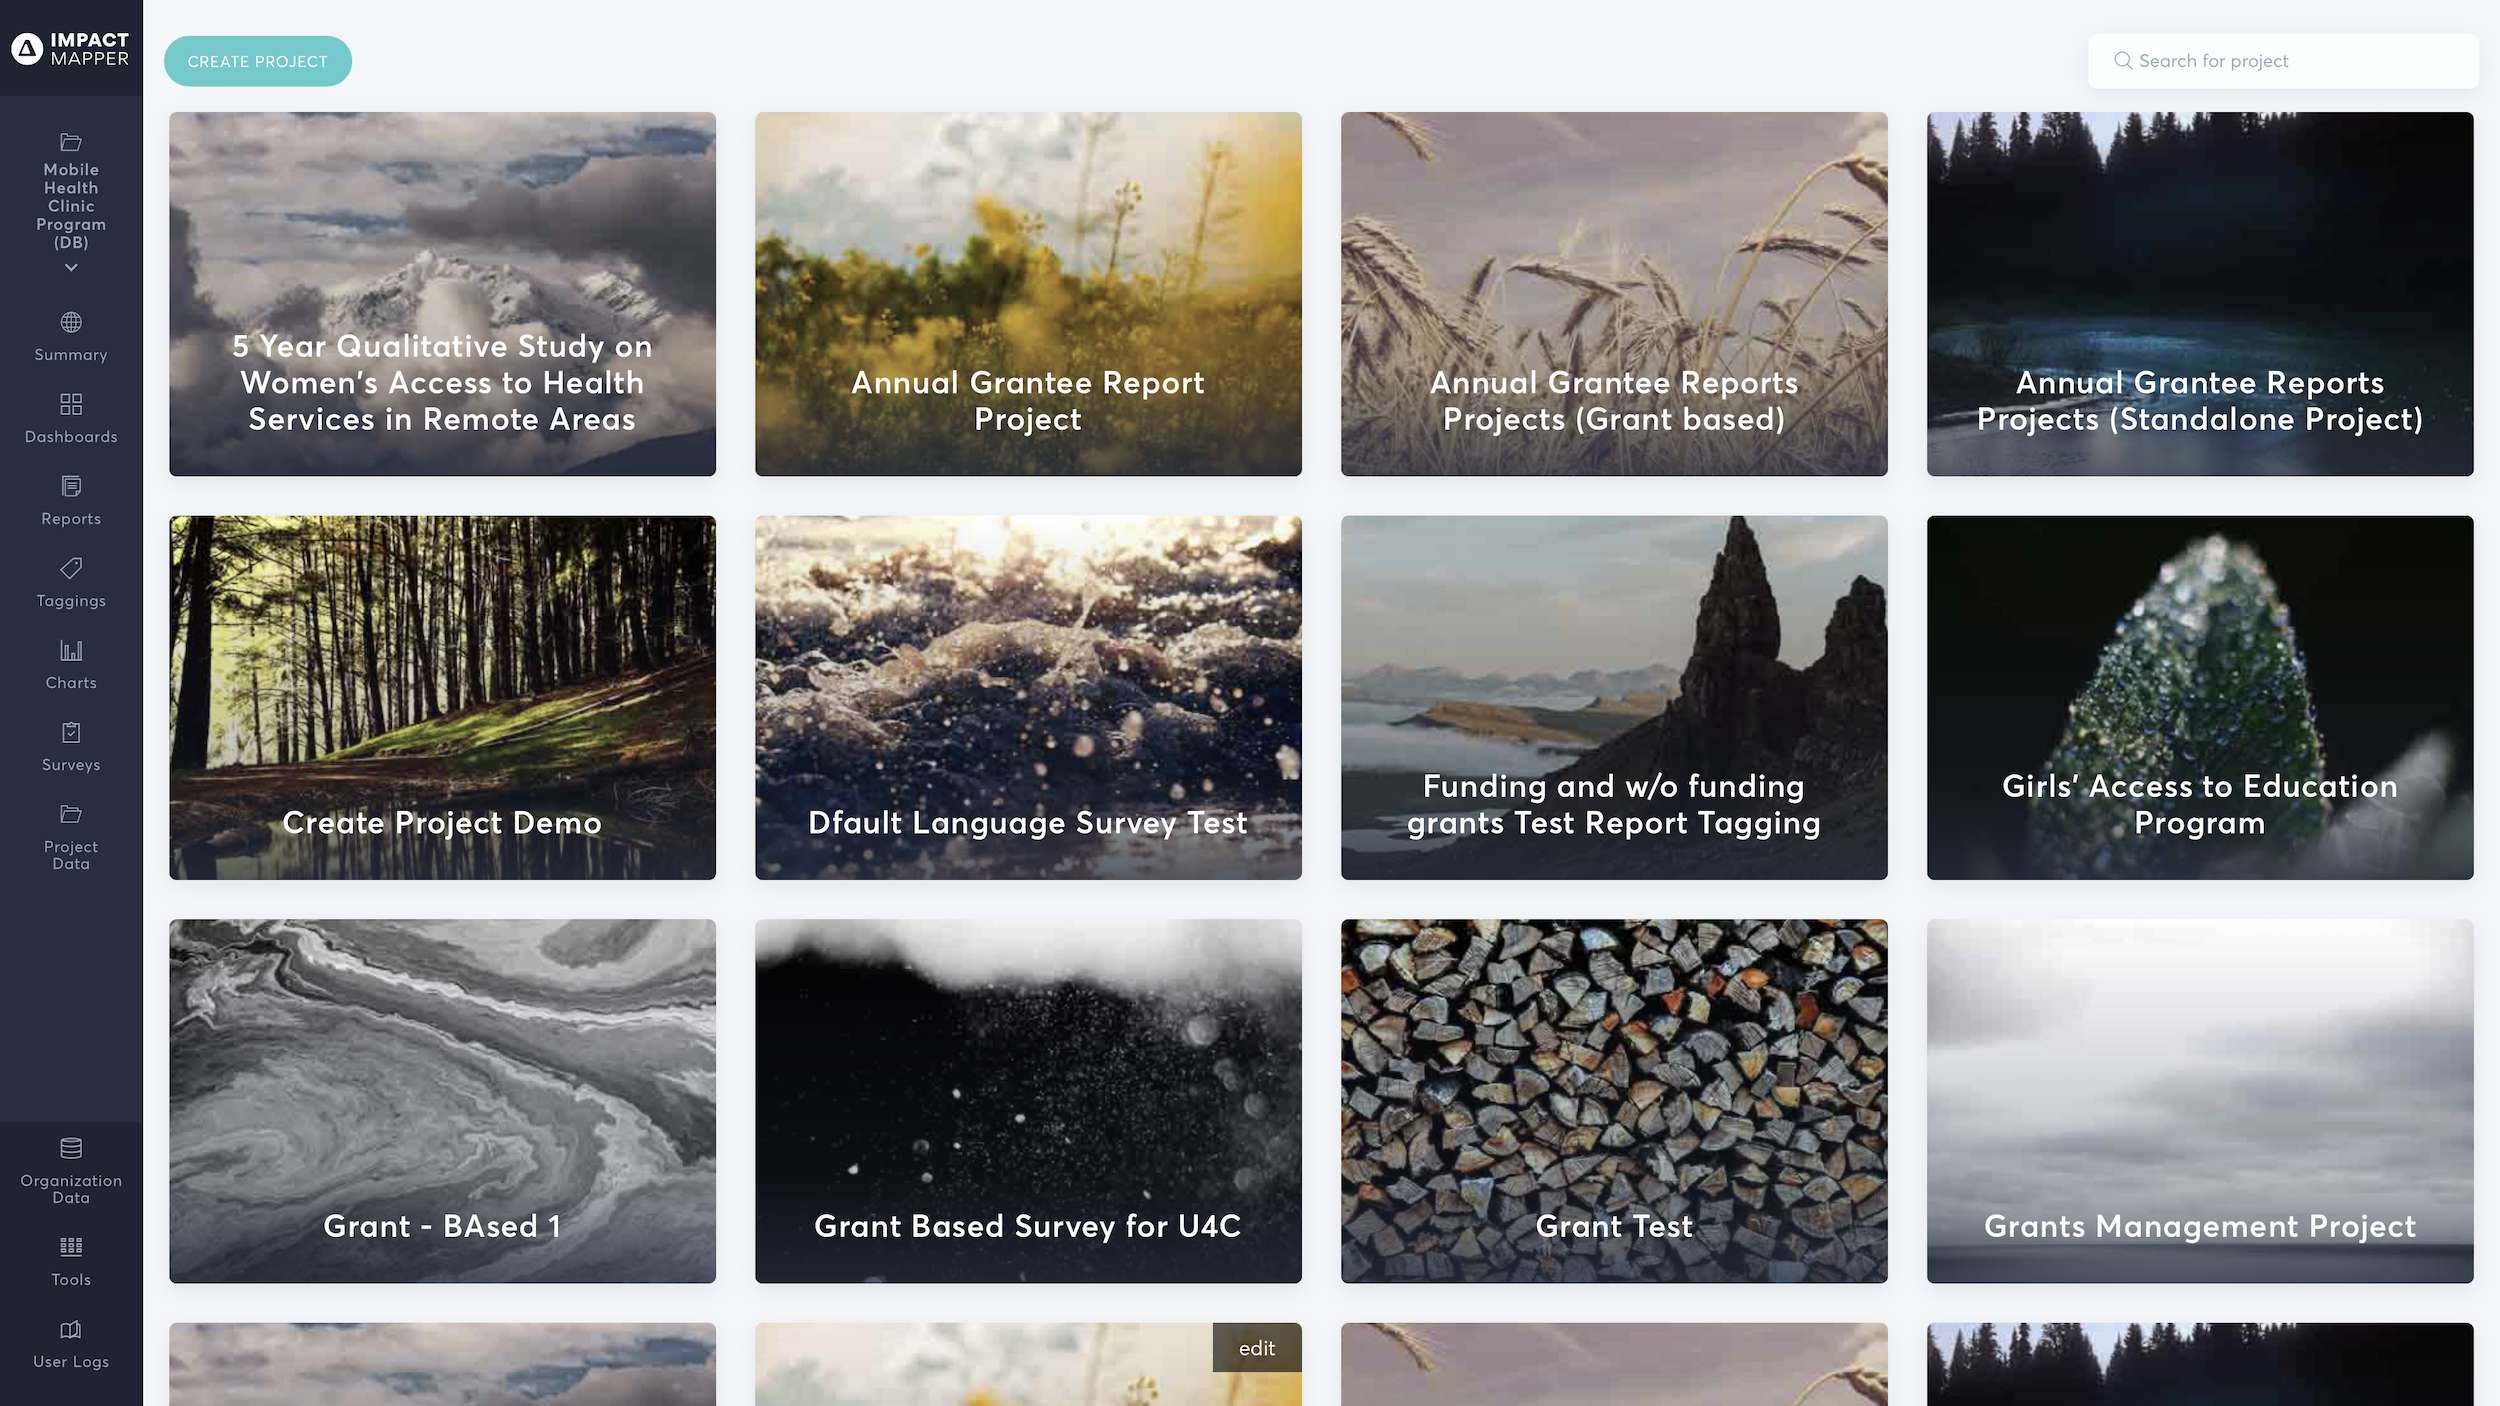
  • Create grant or partner linked projects or a normal project
  • Manage multiple projects supporting different sets of data, stakeholders, and tagging taxonomies
  • Import grant, individual, partner, and funding data in CSV or import existing Fluxx grants and grantee data
  • Filter and sort your data by region, issue, focus area, etc
  • Export in CSV
  • Surveys Auto-translation *
  • Instant AI Insights *
  • AI Report Assistant *
  • *Add-ons at additional cost.
  • Manage a custom dictionary to support your organizational vocabulary
  • Enable 2FA authentication to secure your account
  • Multi-user project access within an organization
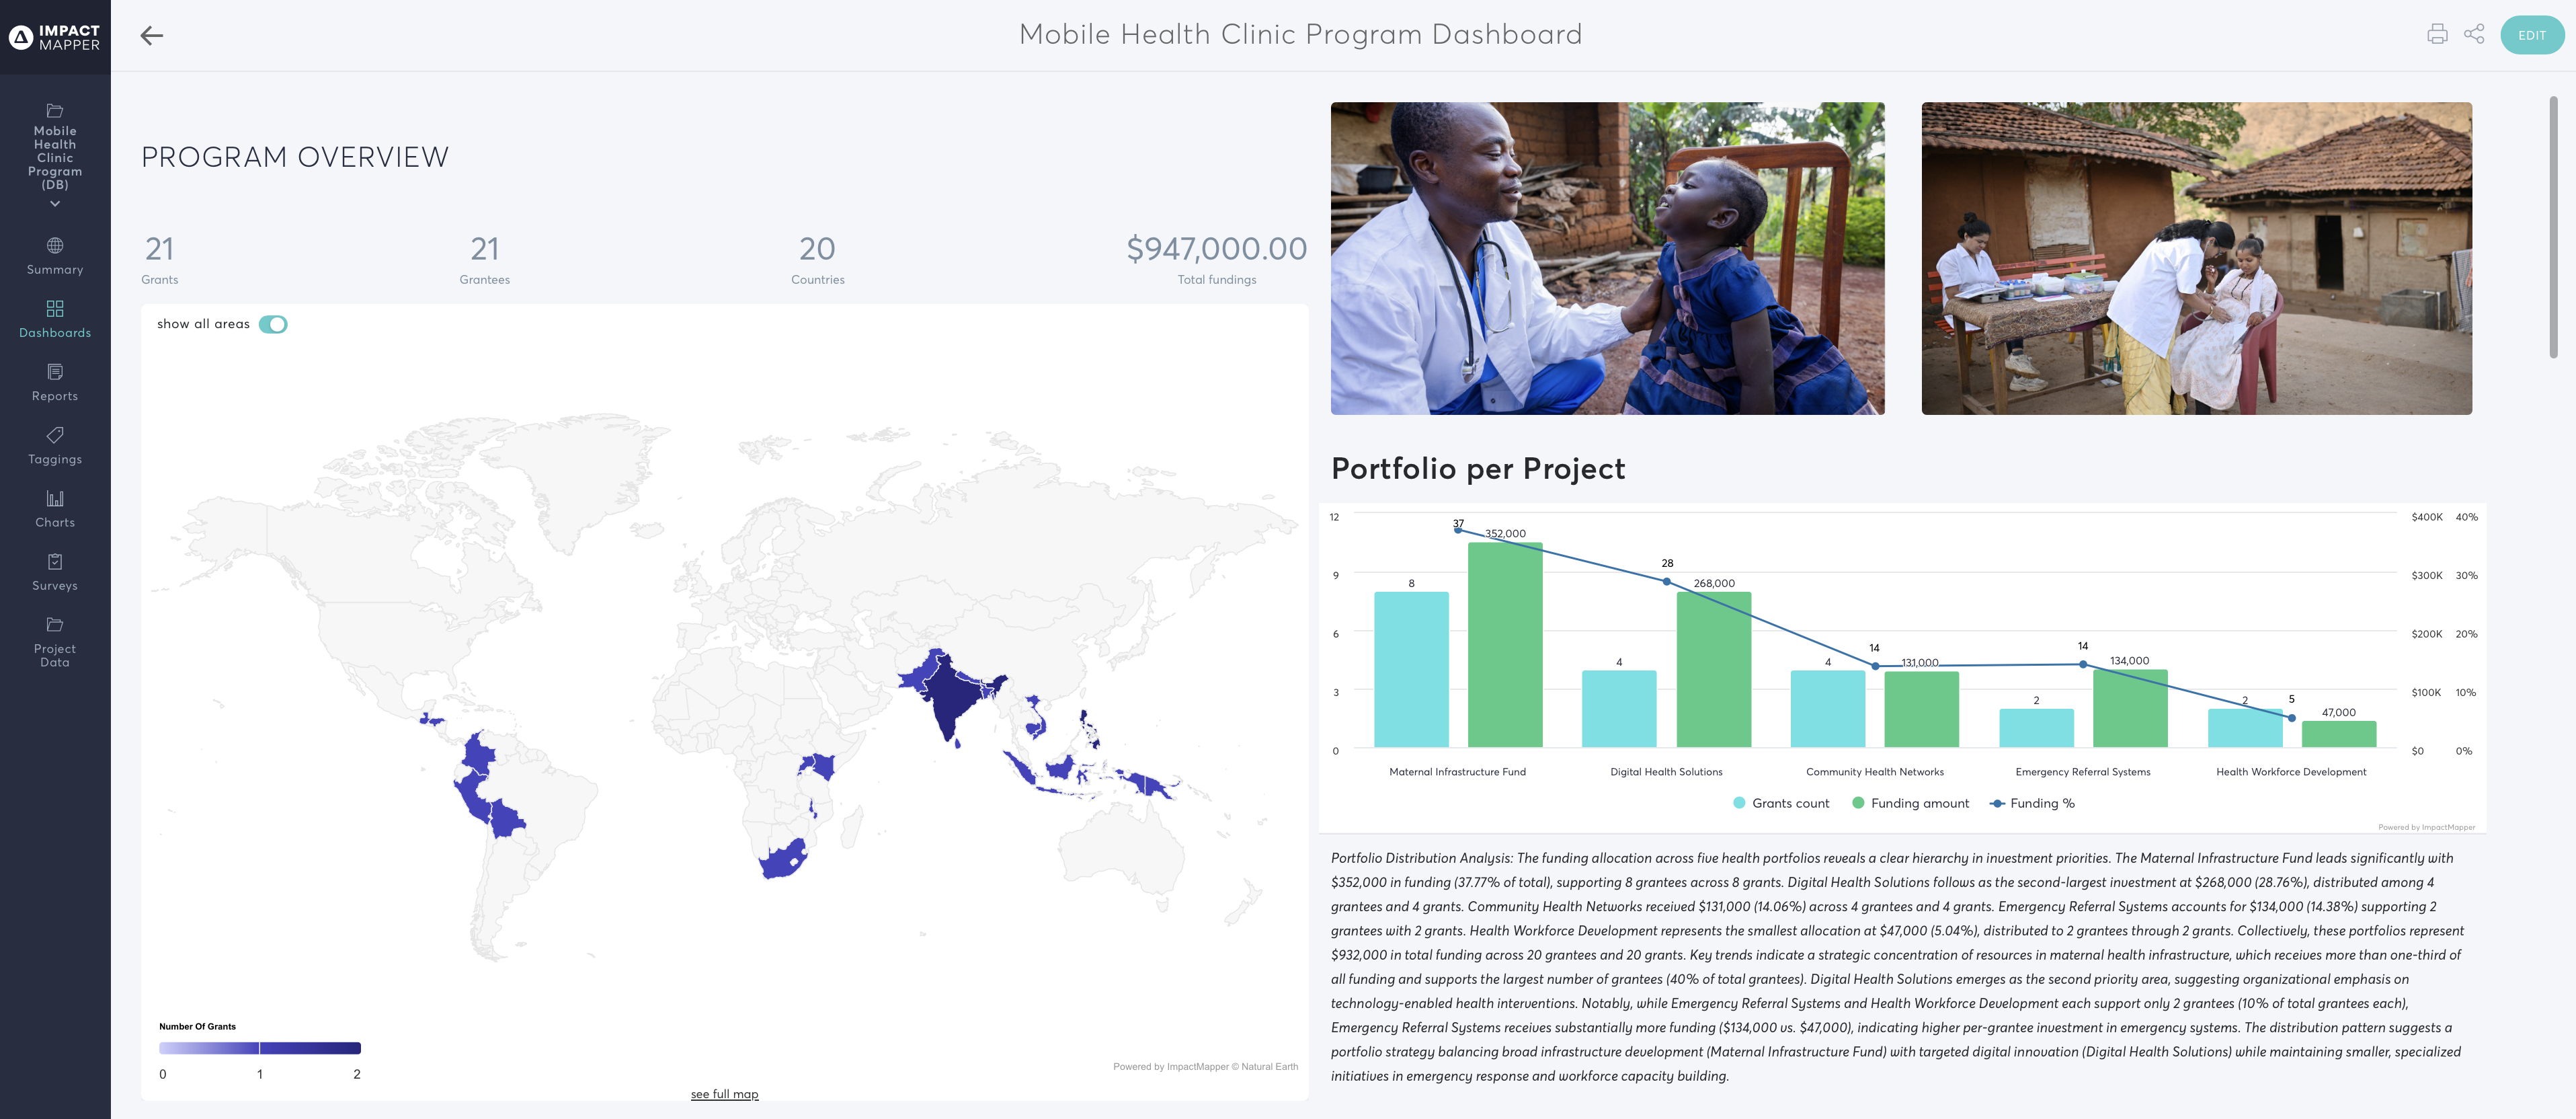
  • Create multiple dashboards for fast and real-time communication to different audiences, such as your board, different donors, your communities, leadership, policymakers, etc
  • Keep track of trends over time, e.g., quarterly or annually
  • Customize the report with headers, subheaders, and text fields
  • Easily add charts, data tables, and maps that you have from your qualitative data analysis, quantitative analysis, and your surveys
  • Include custom editable Hero figures and reach data 
  • Add global maps with grantees or program names or maps from surveys. Maps can be clicked to expand into a detailed view of choice
  • Add pictures and logos to your dashboard 
  • Add quotes that you have saved and place them underneath pictures or anywhere in the report for added impact
  • Add full PDF documents files to your dashboard for deeper dives into associated topics
  • Organize charts vertically or horizontally in the order of preference
  • Organize your dashboard by pages and section breaks 
  • Share your dashboard report through a pdf export or your live dashboard through a unique URL
  • Quickly resize your charts and visuals in the report for good design
  • *Add-on at additional cost.
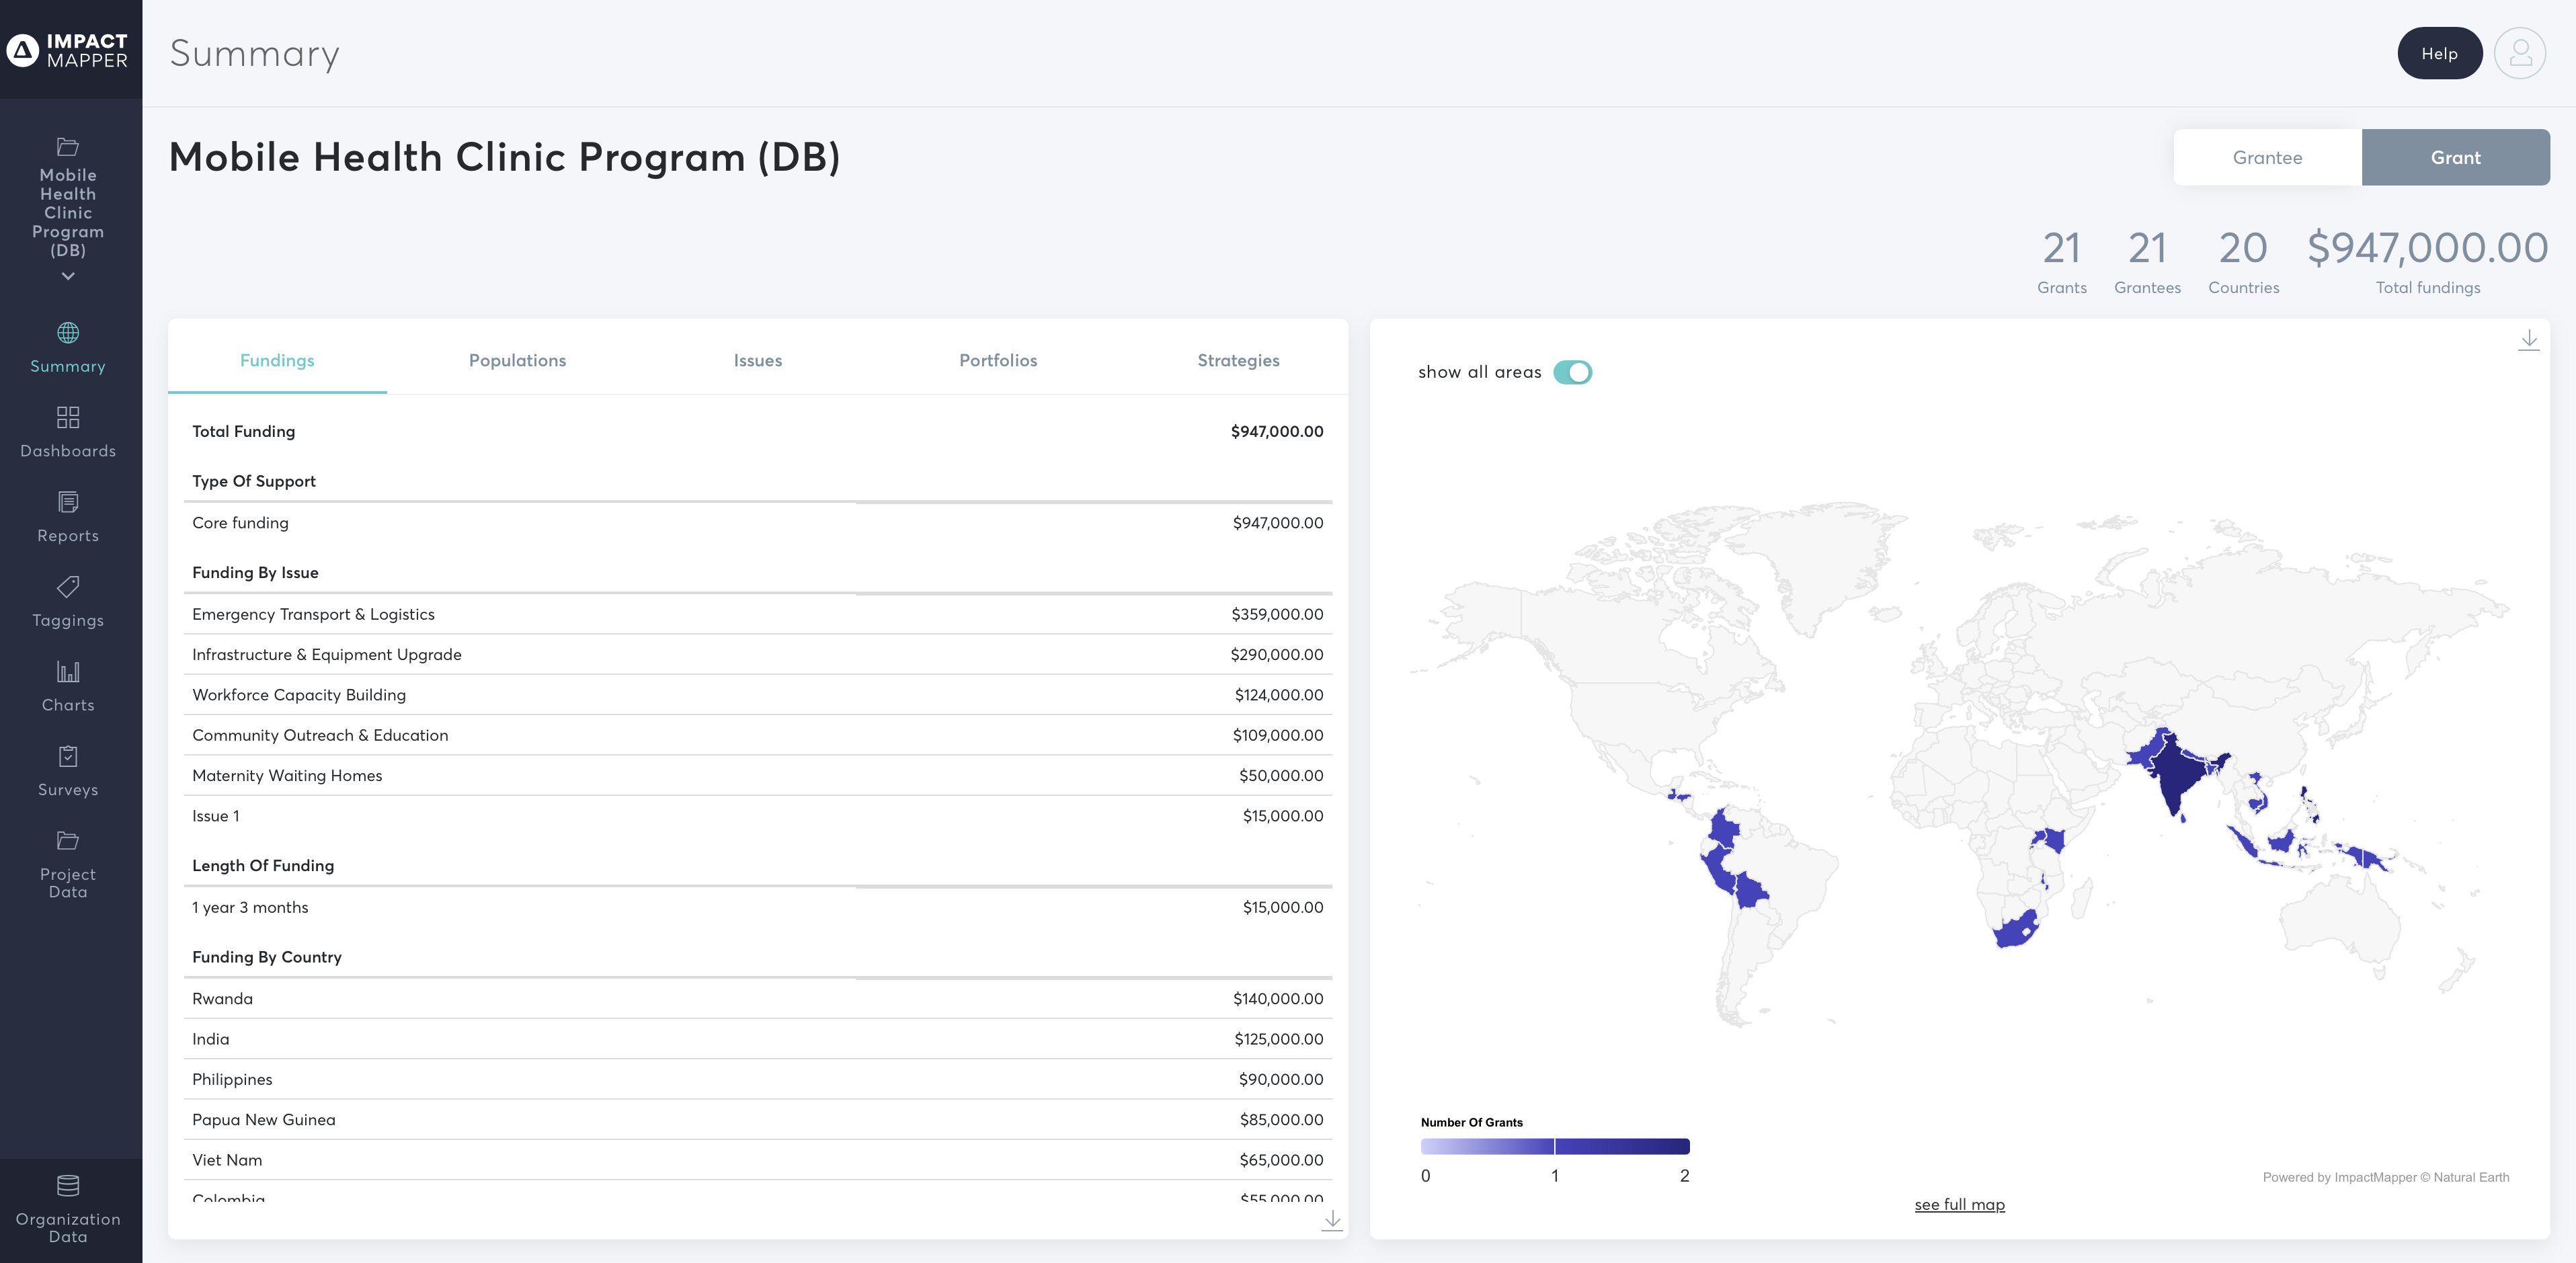
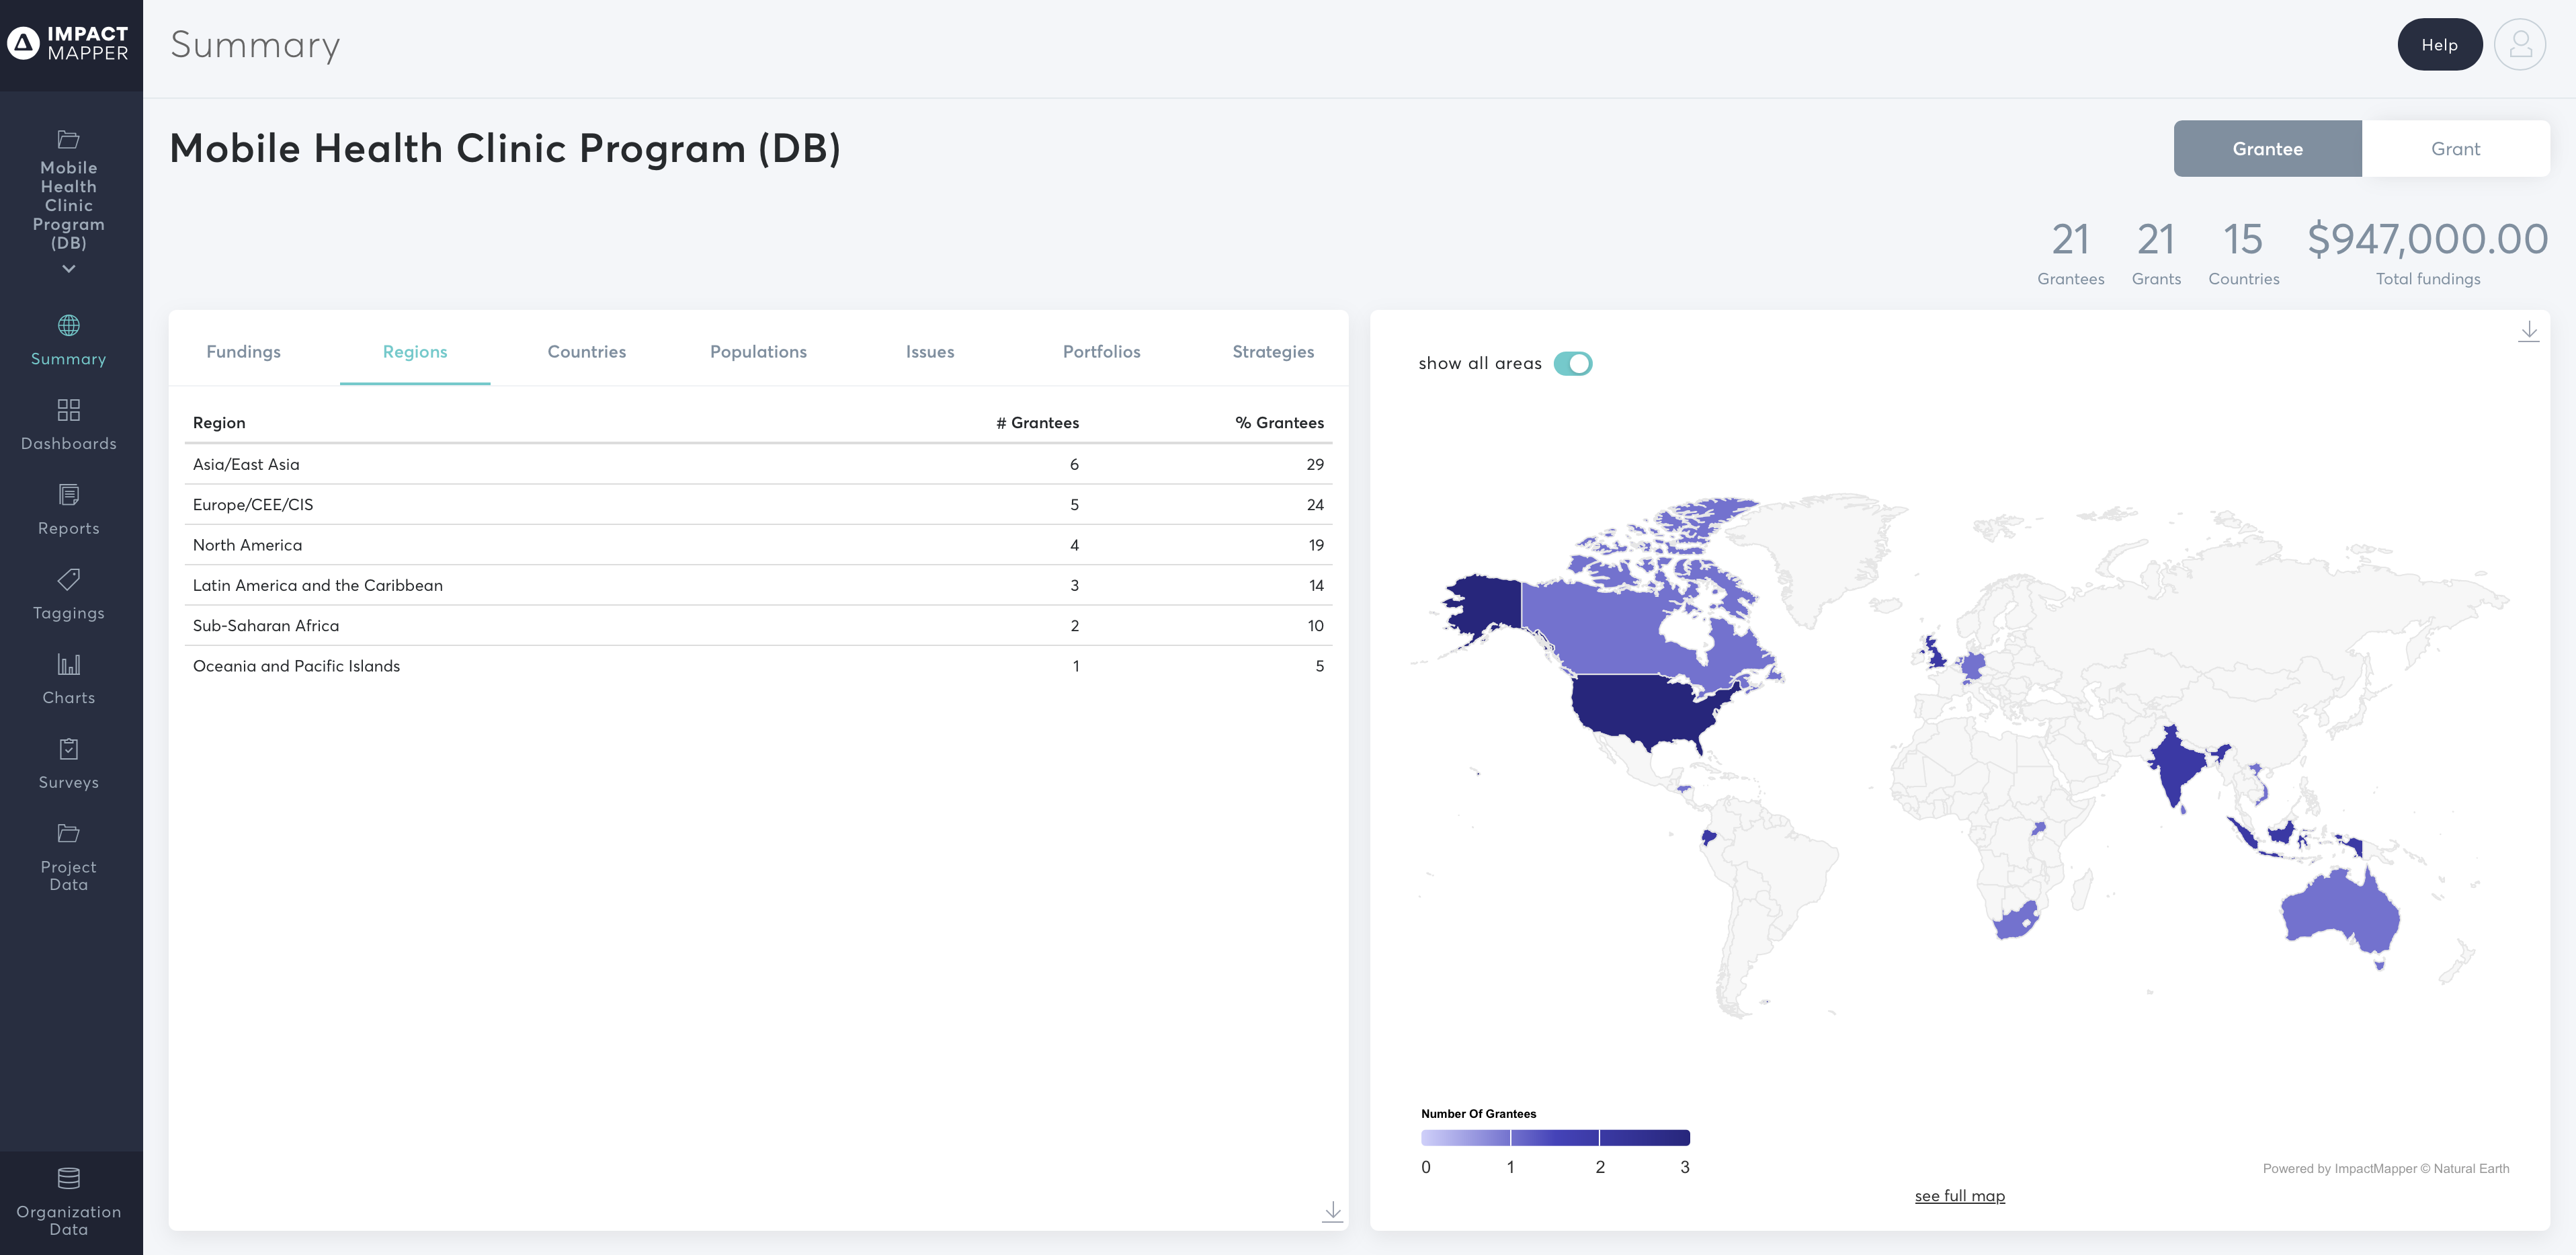
  • Map grants, individuals or partners by location
  • Filter the map based on custom criteria
  • Dashboard summary of financial data trends by country or region
  • Aggregated summary of tags
Features for Seamless Impact Reporting

A great ally for grantmaking and programmatic work

Analyze and visualize your grantmaking or research trends
Upload and analyze documents and grantee reports using your unique taxonomy
Survey, tag, chart, and visualize your partners' impact — all in one tool
AI analysis tools optional
Up and running on day one after onboarding
Statistics

Proven ways our tool makes your work easier

Numbers and stories that tell our user's community success.
60% 
Reduced time spent on
AI-assisted qualitative coding
600%
Return on investment
Features

Design, Analyze, Visualize and Share
Multiple Knowledge Products

Annual Impact Reports

Impact Reports

Board Reports

Evaluation Reports

iPhone mockup

Survey Series

Case Studies

Learning Briefs

Custom Dashboards

Watch: Practical Uses of ImpactMapper

Different ways clients use our software:


Qualitative coding and meta-analysis/synthesis of reports for lessons learned.
Spotlight Initiative used ImpactMapper and had over 240 annual reports and knowledge products from country and regional offices, and headquarters coded for lessons learned. This allowed for the production of the Compendium on Lessons Learned and Good Practices to End Violence Against Women and Girls that the ImpactMapper team created to showcase exemplary case studies across 6 different pillars of work and draw out the main lessons learned across 13 thematic areas in ending violence against women and girls around the world.


Storing, analyzing, and visualizing annual impact data and creating impact reports.
Building Equity and Alignment for Environmental Justice (BEA) uses ImpactMapper as an impact reporting tool for the foundation. Grantee reports are collected through ImpactMapper’s survey tool, surveys are tagged with their outcomes from the Theory of Change, and visualizations are created for annual board, donor, and community reporting. They have over-time analysis embedded as well with baseline and mid-term data to assess diverse changes that occur to transform environmental movements.

Collecting and analyzing stories of change from grantees.
FRIDA The Young Feminist Fund uses ImpactMapper to analyze grantee stories and track outcomes in their theory of change at a portfolio level. This analysis helps them better communicate the diverse and rich changes that have been accelerated through their participatory grantmaking through grantee voices and stories.


Gathering feedback from customers, partners, or staff on operations, events, or specific initiatives.
IKEA used ImpactMapper to survey their customers who came to their Glasgow stores and to gather policymaker impressions on their sustainability exhibits at COP26 in Glasgow.


Impact reporting and inclusive AI innovation.
Malala Fund uses ImpactMapper to assess the impact of all of their grantmaking portfolios and to produce annual impact reporting for the board and the community. Malala Fund has also supported a pilot with ImpactMapper and granted us support to move forward our work on responsible AI used in the software underscoring their deep commitment to support of the philanthropic technological infrastructure.


Faster analysis of data between different software systems through APIs.
An API with Fluxx was supported by Arcus Foundation. The API connects ImpactMapper and Fluxx, a grants management software, and enables grants data to be imported into ImpactMapper faster and in real-time and allows for users to access our visualization features and more easily explore grantmaking trends.


An API with Trint was supported by
Winthrop Rockefeller Foundation.
The API connects ImpactMapper and Trint, a transcription tool that turns audio and video files to text. This enables automatic import of grantee oral reports and interviews for analysis in ImpactMapper, supporting trust-based reporting.

reviews

Testimonials

"The Africa Albinism Network's introduction to Impact Mapper came at the right time. We were looking to map our impact in a manner that made sense to us and to our partners. At Impact Mapper, we found a very efficient team and an intuitive and collaborative software with many possibilities. We have since managed to collect and analyse some deeply insightful data from and for the African albinism community we work with."

Haingo Rakotomalala
Deputy Project Manager, Africa Albinism Network

"As a feminist research lab, we try to choose software and technologies that are aligned with our values. ImpactMapper's commitment to human rights and supporting gender and racial equality is squarely in line with our work to build emancipatory, feminist technologies. Moreover, many other options in the qualitative analysis software space are incredibly expensive, don't support collaboration well, and have poor customer service. ImpactMapper just simply has better features and it is more affordable!We will use ImpactMapper in two upcoming qualitative studies that examine how activists and advocates are increasingly using data science for their movement-aligned work in housing and transgender rights. Another qualitative study we are embarking on looks at grassroots perceptions of surveillance and safety for women and gender minorities in Indian cities. And finally, we will be using ImpactMapper's survey tool to run a global survey of organizations that produce data about feminicide, the gender-related killing of women and girls, including cisgender and transgender women.”

Catherine D'Ignazio
Associate Professor of Urban Science & Planning, Director, Data + Feminism LabDepartment of Urban Studies & Planning, MIT