Your partners are changing the world. Can your board see it?
Impact measurement software for foundations brings grant data, partner reports and financial figures into one place, so you can track outcomes, report to your board and keep what your portfolio teaches you. ImpactMapper is built for exactly that work.
Most foundations already hold the evidence. It sits in hundreds of partner reports, interviews and spreadsheets, often in several languages. The stories of change are there, but pulling them together for a board meeting can take weeks, and the lessons rarely outlive the report.
This guide explains what impact measurement software for foundations should do, how ImpactMapper approaches grant outcome tracking, impact reporting and lessons learned documentation, and what to ask when you choose a platform.
What is impact measurement software for foundations?
Impact measurement software for foundations is a platform that connects what a foundation funds to what that funding achieved. It holds grant and financial data, analyzes qualitative evidence such as partner reports and interviews, and turns both into reports and dashboards for boards and stakeholders.
It differs from a grants management system. A grants management system runs the grant lifecycle: applications, approvals, payments and compliance. Impact measurement software answers the question that comes after: what changed, for whom, and what did we learn?
The best platforms handle qualitative and quantitative data together. Much of what philanthropy learns about sits in text documents, not numbers. A tool that only counts misses most of the story.
Grant outcome tracking: from partner reports to evidence
Grant outcome tracking means linking each grant to the results it contributed to, measured against your own strategy. In ImpactMapper, you import grant data, code partner reports to your taxonomy and Theory of Change, and see outcomes across the whole portfolio.
- Import your grants. Bring in grant, investment or project data by CSV, or connect through APIs with Fluxx, Airtable, Submittable and Trint. Filter by region, issue, partner and funding. We can build any custom API for you as well to connect your data from other platforms.
- Code partner reports to your taxonomy. Upload reports, interviews and stories as PDFs or Word documents, then tag passages against your outcomes. AI autotagging speeds this up and suggests tags; your team decides what stays.
- Track outcomes against your Theory of Change (ToC) or any custom impact framework. Tags become measurable: how many grants contributed to each outcome, in which regions, with how much funding behind them.
- Keep the human story. Save compelling quotes and stories as you code, so every number has the voice behind it.
Because tags are built from your own strategy, tracking reflects how your foundation thinks about change, not a generic template.
Board reporting and impact reporting with shareable dashboards
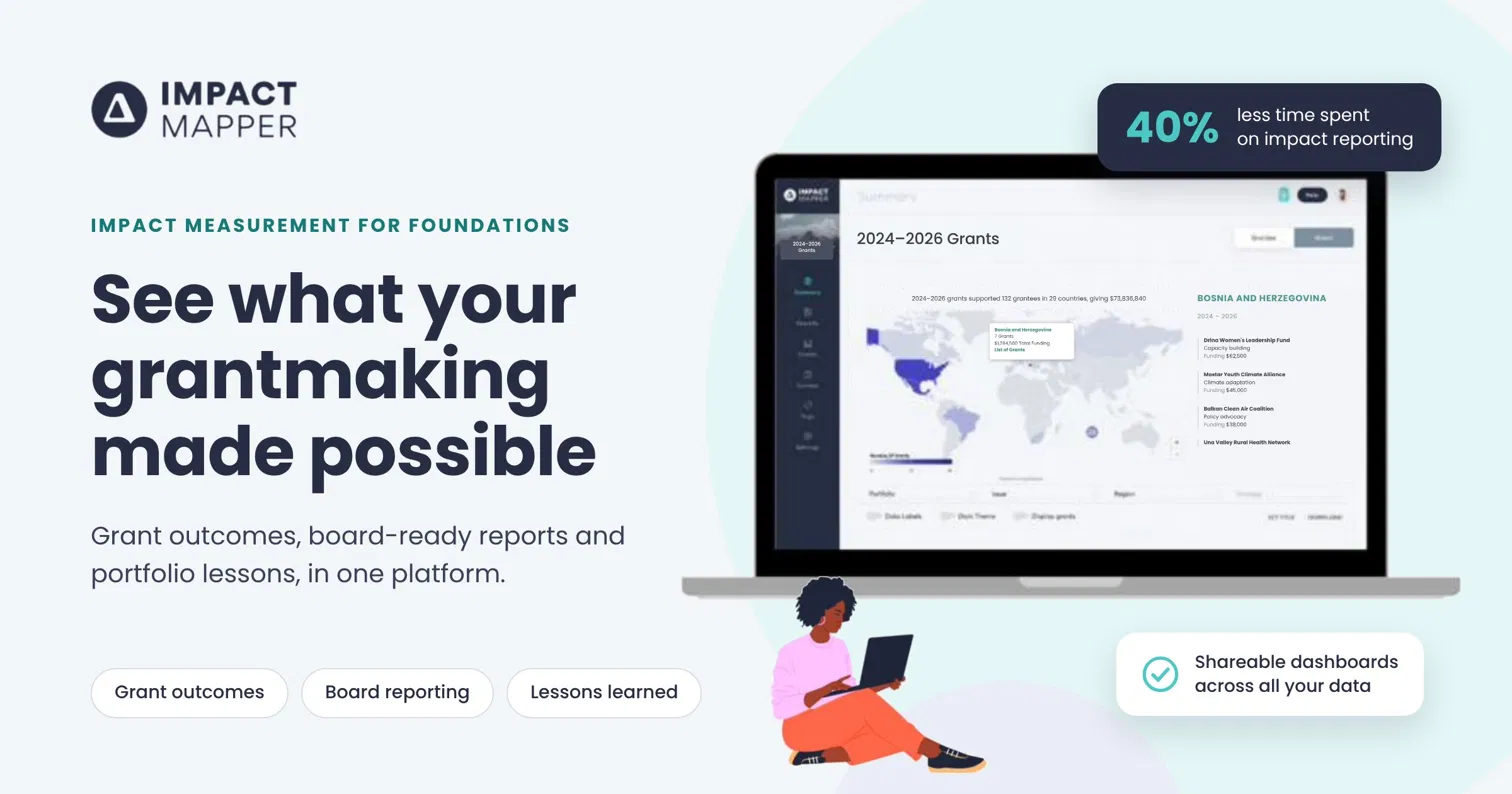
Board-ready impact reporting needs numbers and stories in one view, kept current. ImpactMapper's shareable dashboards pull charts from across all your data, so trustees and stakeholders see live portfolio results rather than a static slide from last quarter.
What the dashboards give your team:
- One view across all your data. Grant data, coded partner reports, survey responses and financial figures sit side by side.
- Live, saved charts. Charts are saved once and stay up to date as new reports and grants arrive.
- A choice of chart types. Column, bar, line, area, pie, stacked, combo, bubble, heatmap and scatter, with filters and calculations such as total funding, averages and percentages.
- Your brand. Charts follow your brand colors.
- Easy sharing. Share a dashboard, or export charts as PNG, PDF or SVG for board packs, presentations and the web, and data tables as CSV.
- AI-assisted insight. Every chart can come with an instant AI analysis, and helps you draft from what you have tagged.
Foundations use these dashboards to build board-ready knowledge products: impact reports, board reports, evaluations, grantmaking briefs, learning briefs, portfolio dashboards and story databases. ImpactMapper clients report at least 40% less time spent on impact reporting.
Lessons learned documentation that outlasts the report
Lessons learned documentation turns what each grant reveals into knowledge the whole foundation can reuse. In ImpactMapper, every tagged passage, quote and survey answer stays searchable, so learning builds up over years instead of disappearing into a filed PDF.
- Searchable over time. Search everything that has been tagged, across cycles, regions and programs.
- Questions answered from your own documents. Automatic Q&A on PDFs finds insights inside partner reports in seconds.
- Learning across languages. Survey autotranslation and multilingual surveys let partners respond in their own language.
- Lessons that leave the system. Learning briefs and story databases share what worked with your board, peers and the field.
When staff change or a strategy is refreshed, the evidence stays.
Grant portfolio management: Text, numeric, and financial data together
Grant portfolio management for impact means seeing where your money went and what it achieved, in the same view. ImpactMapper analyzes partner report text alongside financial and quantitative metrics, so you can ask questions such as how much funding went to each outcome, and where.
- See funding by region, issue, partner and outcome on a world map and in charts.
- Compare portfolios, cohorts or grant cycles side by side.
- Collect fresh data from partners with custom surveys and instant charting.
- Keep working in the systems you already use, with APIs for Fluxx, Airtable, Submittable and Trint.
The same platform serves foundations, corporates running CSR portfolios, nonprofits, and impact investors.
Foundation software selection: Key questions to ask
When you choose impact measurement software for your foundation, judge it on whether it handles your real evidence and fits how your team works. These seven questions separate tools that report from tools that help you learn.
- Can it analyze qualitative data such as reports, interviews and stories? Most philanthropic evidence arrives as text. ImpactMapper codes PDFs and Word documents to your taxonomy, with AI autotagging (optional add-on).
- Can it measure against our own taxonomy and Theory of Change? Generic metrics miss your strategy. In ImpactMapper, tags are built from your framework.
- Does it combine text with financial data? Boards ask what the money achieved. ImpactMapper brings text, surveys and financial figures into one view.
- Can we share live results with the board? Static decks go stale. ImpactMapper offers shareable dashboards and exportable charts.
- Does it connect to our grants management system? Double entry wastes staff time. ImpactMapper has APIs with Fluxx, Airtable, Submittable and Trint.
- Is our data secure, and how is AI used? Partner data is sensitive. ImpactMapper uses encrypted AWS databases in Germany and multi-factor authentication. AI is an optional add-on that runs only when you switch it on, no prompts are stored after models run, and your data stays yours.
- Is there expert support beyond the software? Software alone rarely fixes a measurement framework. ImpactMapper's in-house MEL consulting team supports onboarding and can help build impact frameworks and metrics, TOCs, taxonomies and evaluations. See our consulting work. https://impactmapper.com/consulting-service
Leading foundations use ImpactMapper's software and consulting team together to measure what their grantmaking makes possible.
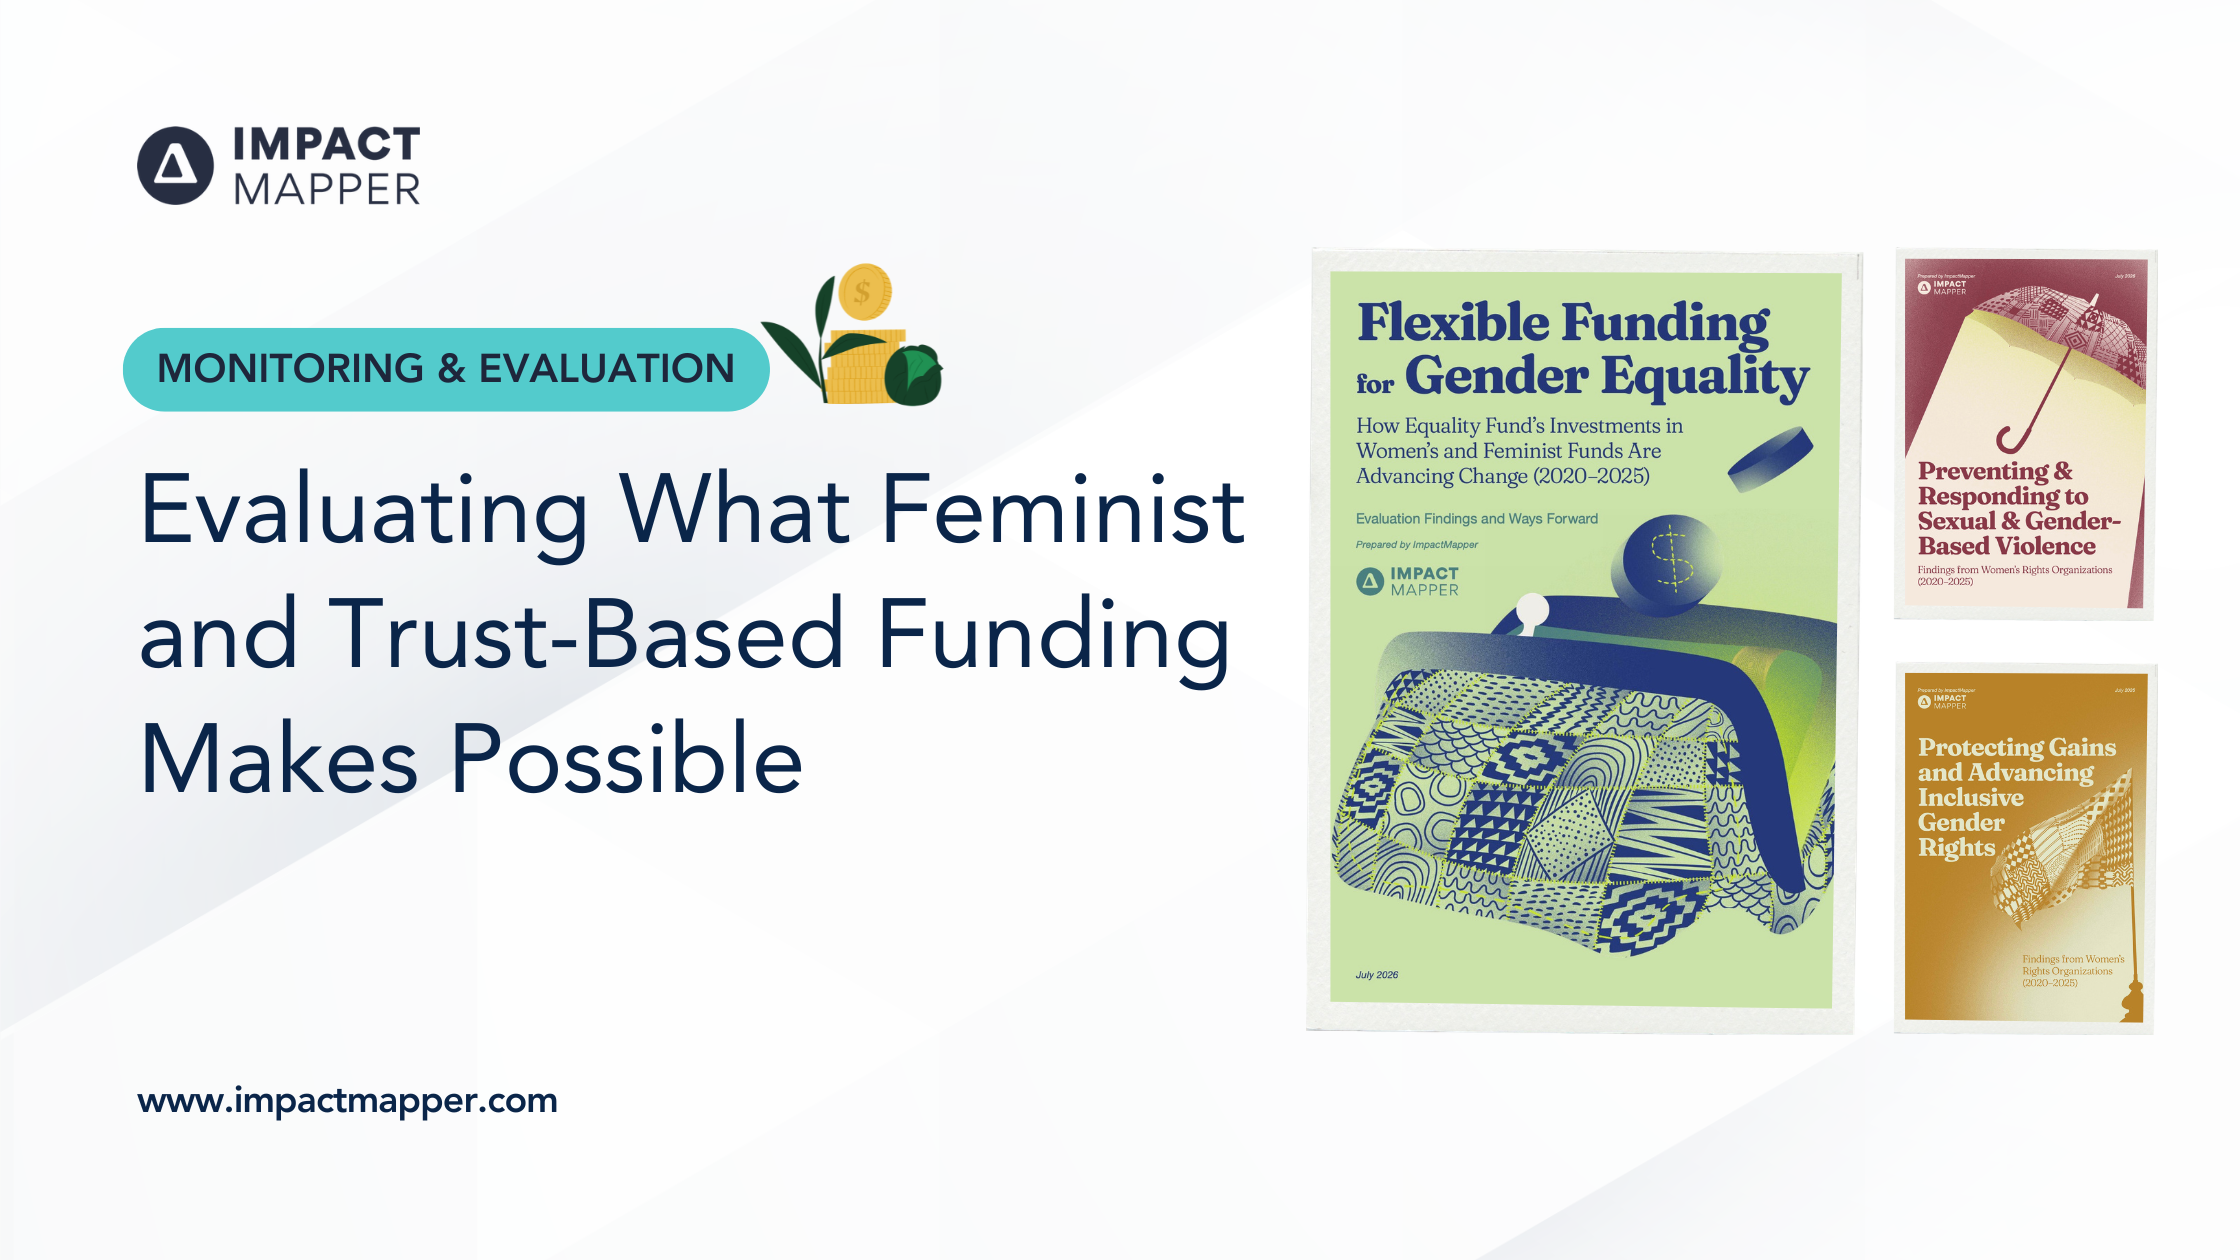
- Equality Fund. Evaluated a $61M CAD portfolio across 40 funds over 5 years, producing three funder-facing briefs on what the investment achieved.
- Clara Lionel Foundation (CLF). Multi-year MEL partner rebuilding the impact framework, outcomes and grantee reporting for climate justice, arts & culture, and fellowship grantmaking. Using ImpactMapper software.
- Fondation CHANEL: Multi-year learning partner, defined an organization-wide grant taxonomy with the global leadership team, then coded every grant against it for board reporting. Currently analyzing outcomes from the Europe grantmaking in the ImpactMapper software and producing a synthesis report on trends.
- Spotlight Initiative (EU and UN Fund). Coded and synthesized almost 300 program documents and interviews in the ImpactMapper software from a €500M investment and wrote a Compendium and lessons learned document of 50+ case studies across six outcome areas and 13 thematic briefs.
- WINGS. Building a digital self-reflection tool so philanthropic support organizations can assess progress against 10 systems-change principles aligned with the Philanthropic Transformation Initiative report, using ImpactMapper's survey engine.
- Great Plains Housing Initiative: Helped their impact investing fund and their nonprofit housing line of work develop its theory of change and measurement approach to expand housing access in Native American communities. Using Impactmapper software to track annual progress from its partners, including native communities, developers, and CDFIs.